Prioritizing aquatic barriers for removal
Aquatic barriers are identified and measured for their potential impact on aquatic organisms:
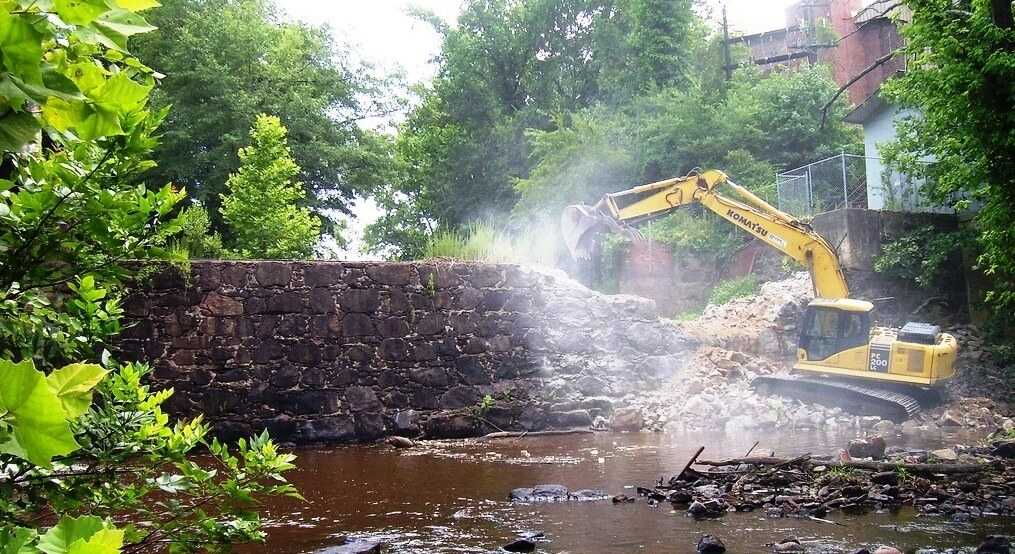
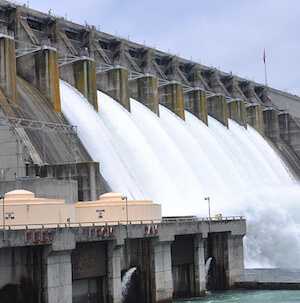
Aquatic barriers are natural and human-made structures that impede the passage of aquatic organisms through the river network.
They include:
- Waterfalls
- Dams
- Road-related barriers
Where possible, human-made barriers have been assessed using field reconnaissance to determine their likely impact on aquatic organisms as well as their feasibility of removal. You can leverage these characteristics to select a smaller number of barriers to prioritize.
Aquatic barriers are measured for their impact on the aquatic network:
Functional aquatic networks are the stream and river reaches that extend upstream from a barrier or river mouth to either the origin of that stream or the next upstream barrier. They form the basis for the aquatic network metrics used in this tool.
To calculate functional networks, all barriers were snapped to the USGS High Resolution National Hydrography Dataset (NHDPlus). Where possible, their locations were manually inspected to verify their correct position on the aquatic network.
Read more about network analysis methods.
Note: due to limitations of existing data sources for aquatic networks, not all aquatic barriers can be correctly located on the aquatic networks. These barriers are not included in the network connectivity analysis and cannot be prioritized using this tool. However, these data can still be downloaded from this tool and used for offline analysis.
Barriers are characterized using metrics that describe the quality and status of their functional networks:
Network Length
Network length measures the amount of connected aquatic network length that would be added to the network by removing the barrier. Longer connected networks may provide more overall aquatic habitat for a wider variety of organisms and better support dispersal and migration.
Read more...
Network Complexity
Network complexity measures the number of unique upstream size classes that would be added to the network by removing the barrier. A barrier that has upstream tributaries of different size classes, such as small streams, small rivers, and large rivers, would contribute a more complex connected aquatic network if it was removed.
Read more...
Channel Alteration
Altered river and stream reaches are those that are specifically identified as canals or ditches. These represent areas where the hydrography, flow, and water quality may be highly altered compared to natural conditions.
Read more...
Natural Landcover
Natural landcover measures the amount of area within the floodplain of the upstream aquatic network that is in natural landcover. Rivers and streams that have a greater amount of natural landcover in their floodplain are more likely to have higher quality aquatic habitat.
Read more...
Metrics are combined and ranked to create three scenarios for prioritizing barriers for removal:
Network Connectivity
Aquatic barriers prioritized according to network connectivity are driven exclusively on the total amount of functional aquatic network that would be reconnected if a given dam was removed. This is driven by the network length metric. No consideration is given to other characteristics that measure the quality and condition of those networks.
Watershed Condition
Aquatic barriers prioritized according to watershed condition are driven by metrics related to the overall quality of the aquatic network that would be reconnected if a given dam was removed. It is based on a combination of network complexity, percent unaltered, and floodplain natural landcover. Each of these metrics is weighted equally.
Network Connectivity + Watershed Condition
Aquatic barriers prioritized according to combined network connectivity and watershed condition are driven by both the length and quality of the aquatic networks that would be reconnected if these barriers are removed. Network connectivity and watershed condition are weighted equally.
To reduce the impact of outliers, such as very long functional networks, barriers are scored based on their relative rank within the overall range of unique values for a given metric. Many barriers have the same value for a given metric and are given the same relative score; this causes the distribution of values among scores to be highly uneven in certain areas.
Once barriers have been scored for each of the above scenarios, they are binned into 20 tiers to simplify interpretation and use. To do this, barriers that fall in the best 5% of the range of scores for that metric are assigned to Tier 1 (top tier), whereas barriers that fall in the worst 5% of the range of scores for that metric are assigned Tier 20 (bottom tier).
Note: tiers are based on position within the range of observed scores for a given area. They are not based on the frequency of scores, such as percentiles, and therefore may have a highly uneven number of barriers per tier depending on the area. In general, there are fewer barriers in the top tiers than there are in the bottom tiers. This is largely because many barriers share the same value for a given metric.
